To debug analysis technique Microsoft CLR Debugger must be installed in your system. See Installing Debugger.
To start debugger:
- Click on Microsoft Windows Start button.
- Select All Programs->Microsoft .NET Framework SDK v2.0->Tools->Microsoft CLR Debugger menu item.
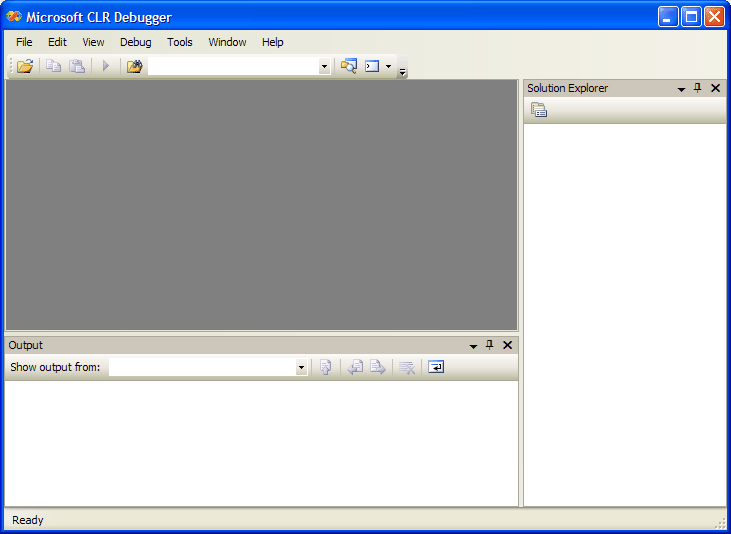
- Microsoft CLR Debugger will appear on the screen:

To attach debugger to NeedForTrade Studio:
- Select Tools->Attach to Process... from Microsoft CLR Debugger
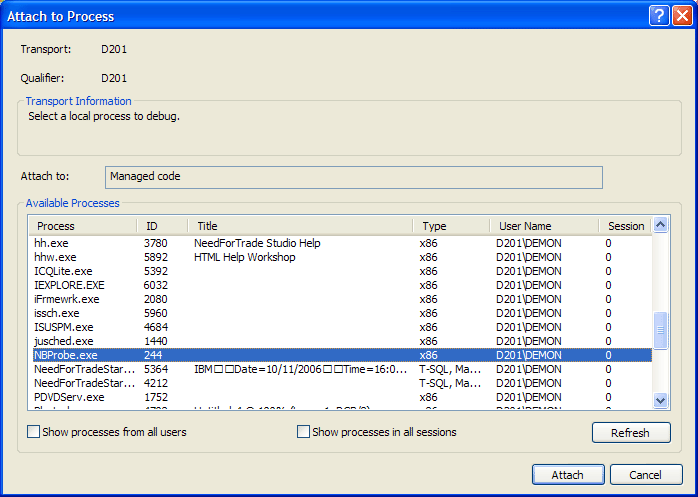
main menu, or press Ctrl-Alt-P. Attach to process dialog will appear on the screen:

- Scroll Available Processes list to find NeedForTradeStartup.exe
process and select it, as shown on the picture above.
To speed up this operation you can click somewhere in the Available Processes list and press N key - and you will be moved to the first process which name is started with the N char. - Click Attach button.
- Now you are ready to debug analysis techniques.
It's highly reccommended to perform initial exception handling setup if you haven't done that before.
See also Debugging Analysis Techniques.